What is the State of Integrity
The State of Integrity is a data analysis project which started in earnest in 2023. With over 11,000 assessments on 410k miles of pipeline from 17 pipeline operators and 34 inline inspection (ILI) companies, OneBridge Solutions (now Irth Solutions) is believed to have amassed the largest and most diversified set of ILI data in the industry. Comparing this to US pipeline mileage, that’s 32% of the assessable pipeline mileage reported to PHMSA in 2023 i.e. natural gas transmission and hazardous liquid gathering and transmission. Additionally, CIM contains ILI reports from 230 different ILI technologies or combinations of technologies for a total of 225 million features and 165 anomalies. That’s a lot of data!
The Data
Since its inception in 2017, pipeline operators have uploaded inline inspection (ILI) reports into the Cognitive Integrity Management or CIM platform. In addition to inline inspection data, other attributes that characterize a pipeline are housed in CIM via integration with an operator’s GIS, e.g., the pipeline vintage, coating, locations of consequence, etc. User input and actions undertaken within the platform are also stored, e.g., what conditions are used to analyze an inline inspection, what anomalies are identified for action, what anomalies are repaired, etc. Additionally, repair information of anomalies identified for evaluation can also be uploaded to the platform. This last piece of the puzzle allows for the characterization of ILI performance.

The Problem Statement
The State of Integrity project includes any insights gleaned from the analysis of said data. Everything from pipeline properties to trends in ILI technology, trends in ILI vendor usage amongst the industry and operators of different sizes, the most utilized anomaly conditions, and how anomaly types have changed over time are just a few of the studies conducted as part of this project. However, ILI performance has generated the most interest from our clients (to no one’s surprise.) For PPIM 2025, it was decided that answering the question of “Who has the best ILI performance?” wasn’t much of an interesting question. Besides, this question would only benefit a few stakeholders. Instead, “What factors contribute to a high ILI performance?” was found to be a better, more interesting question. And one that would benefit all stakeholders.
What is a high-performing? What inline inspections?
For a multitude of reasons, performance was analyzed for metal loss inspection systems only i.e. MFL and UT, utilizing the depth of the metal loss. Furthermore, performance is quantified in a similar manner to API 1163. Thus, the terms certainty and tolerance are utilized where tolerance is the range that the field-found depth is within the ILI-predicted depth. Certainty is the percentage (or probability) that this occurs. For example, if an ILI vendor is within +/- 10% of the field-found depth, 90% of the time, 90% is the certainty, and 10% is the tolerance. In Figure 2 below, you can see that the certainties ranged from 54.5% to 96.1%, meaning that the ILI company with the best performance, Vendor Q, was within +/-20% of the field-found depth, over 96% of the time, while Vendor T was within +/- 20% only 54.5% of the time.

Certainties were calculated using the comparison of ILI-predicted depths versus field-found depths. After some extensive data cleanup, the data that was analyzed consisted of:
- 81,497 anomalies that had both an ILI-predicted depth and a field-found depth
- Mostly identified as external corrosion or external metal loss (81%)
- Mostly general corrosion or pitting (74%)
- Mostly from MFL-A, standard resolution (77%)
- 54% from liquid pipeline operators and 46% from gas pipeline operators
What factors were analyzed?
Various factors were analyzed to determine their effect on performance, and for some factors, the highest performer was identified. The following were analyzed:
- ILI company
- ILI technology, i.e., MFL-A, high-resolution MFL, MFL-C, combination MFL, and UT
- Pipeline operator
- Depth of metal loss
- Number of assessments (experience) for both ILI company and pipeline operator
- Assessment year/time
What drives performance?
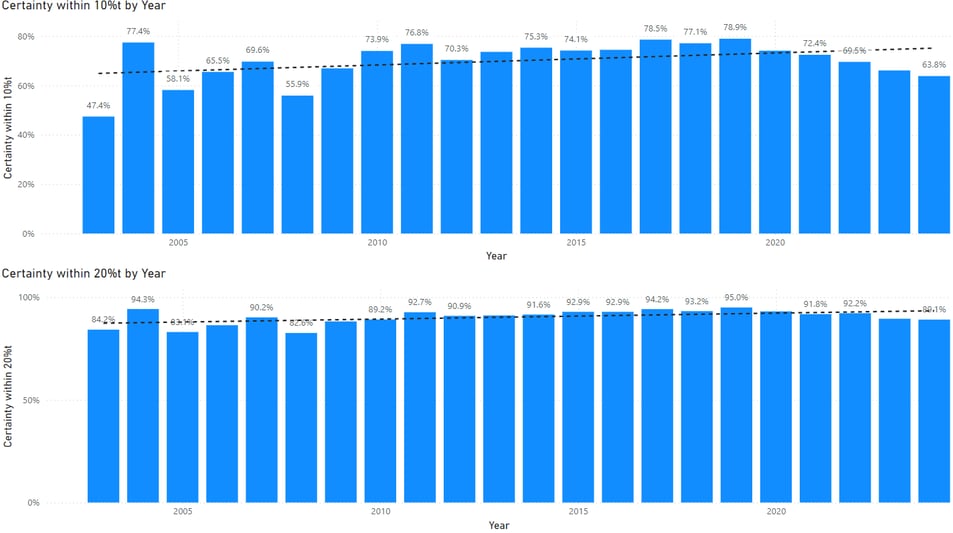
The results of this study are provided in the paper presented at PPIM 2025. However, we will leave you with the results of our last analysis, which posed a lingering question. Not only was performance assessed for multiple variables, but performance over time was also analyzed. As you can see from Figure 3 below, although performance has improved overall, recently, performance has decreased from 2020 until 2024. What’s the reasoning? What has changed in recent years to cause a decrease in performance? Why are the calculated certainties in 2024 similar to the calculated certainties in the 2000s?
 Figure 3: Certainty with a 10% and 20% tolerance by assessment year, 2003 to 2024
One hypothesis is that ILI systems have plateaued in their progress, as significant technological gains did not occur as they did between 2003 and 2019. However, a plateau of technological advancement would not cause a decline in performance.
Another cause might be the change in NDE technology utilized to determine the depth of anomalies “in the field.” As manually operated pit gauges are being replaced by automated laser scans of corrosion fields, the field-produced depths are becoming more accurate. Is the advancement of NDE technology increasing the discrepancies between the ILI-predicted depths and the “truth data?”
Another possible explanation is that the anomalies are changing (or at least the anomalies pipeline operators choose to evaluate are changing). Could the anomalies in recent years be of a morphology that’s more difficult to size for our current ILI systems?
What is your hypothesis? We’d love to hear your thoughts at marketing@onebridgesolutions.com.


